Understand the supply curve in economics and apply it to real B2B sourcing decisions. Learn the difference between supply shifts and quantity supplied, the factors that influence supplier capacity and pricing, and practical ways to reduce inventory risk, manage landed costs, and build a more flexible China sourcing strategy.
A supply curve shows how much of a product suppliers are willing and able to offer at different price levels. For B2B buyers, sellers, and sourcing platforms, it is more than an economics diagram: it is a practical framework for anticipating price changes, supplier capacity constraints, stock availability, and procurement risk.
When you source products from China for international resale, understanding the supply curve can help you decide when to buy, how much inventory to hold, whether to diversify suppliers, and when a dropshipping model may reduce risk.
Table of Contents
What Is a Supply Curve?
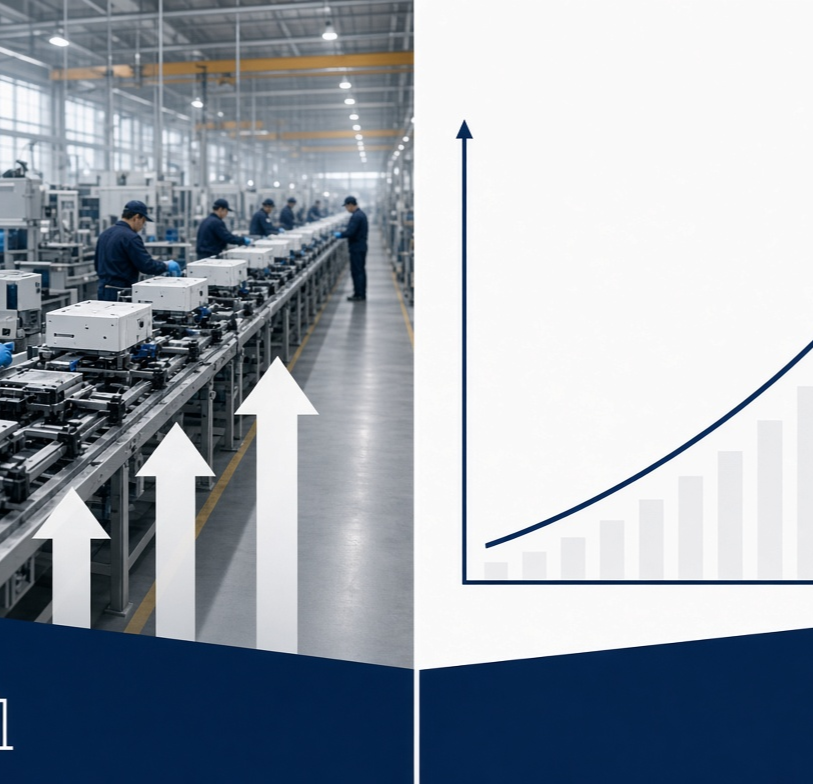
In economics, a supply curve is a graph that represents the relationship between a product’s price and the quantity supplied by producers or sellers over a given period.
Conventionally:
– The vertical axis (Y-axis) represents price.
– The horizontal axis (X-axis) represents quantity supplied.
– The curve usually rises from left to right.
– A higher selling price generally encourages suppliers to offer more units.
This upward relationship is called the law of supply. Assuming other conditions remain unchanged, suppliers are normally willing to produce or sell more when prices increase, because higher prices can improve margins or make additional production commercially viable.
For example, a factory may be willing to produce 5,000 units of a private-label kitchen item at $4 per unit, but expand production to 15,000 units if the market price rises to $6. The higher price may justify overtime labor, additional material purchases, or investment in another production line.
Supply Curve vs. Supply Schedule
A supply schedule is the data table behind the chart. A supply curve turns those data points into a visual model.
| Unit price | Quantity supplied per month |
| $4 | 5,000 units |
| $5 | 8,000 units |
| $6 | 12,000 units |
| $7 | 16,000 units |
When plotted, these figures typically create an upward-sloping line. The curve does not guarantee that suppliers can instantly provide unlimited stock. It shows their willingness and capability to supply at different price points under stated market conditions.
How the Law of Supply Works
The law of supply states that, all else being equal, the quantity supplied rises as price rises and falls as price falls. Economists call this assumption *ceteris paribus*—other relevant conditions, such as input costs, technology, regulations, and supplier capacity, are unchanged.
The logic is straightforward:
1. A higher price can create a stronger profit incentive.
2. Suppliers may increase output, add shifts, or use more capacity.
3. New suppliers may enter an attractive market.
4. A lower price can make marginal production unprofitable.
5. Suppliers may reduce output, delay replenishment, or prioritize other products.
However, B2B procurement teams should avoid treating this relationship as automatic. In real supply chains, production may be restricted by minimum order quantities, tooling lead times, raw-material availability, compliance requirements, labor conditions, port congestion, and financing capacity.
A supplier may want to produce more at a higher price but still be unable to do so quickly.
Movement Along the Curve vs. a Shift in Supply
One of the most important distinctions in supply-curve economics is the difference between a movement along the supply curve and a shift of the supply curve.
Movement Along the Supply Curve
A movement along the same curve happens when the product’s own price changes while other factors remain constant.
For instance:
– A wholesale buyer accepts a higher price for insulated water bottles.
– The manufacturer responds by allocating more factory capacity to that product.
– Quantity supplied increases.
– The supplier moves to a higher point on the existing supply curve.
This is a change in quantity supplied, not necessarily a change in overall supply.
Shift in the Supply Curve
A supply curve shifts when a factor other than the product’s own price changes. A shift affects how much suppliers can or will offer at every possible price.
– A rightward shift means supply has increased.
– A leftward shift means supply has decreased.
| Change in market condition | Typical supply effect | Likely curve direction |
| Lower raw-material prices | More output becomes economically viable | Right |
| Improved manufacturing technology | Greater productivity and capacity | Right |
| More qualified suppliers enter | Total market capacity increases | Right |
| Higher labor, energy, or material costs | Production becomes more expensive | Left |
| New taxes, restrictive rules, or tariffs | Supplier costs or friction rise | Left |
| Factory disruption or natural disaster | Available output falls | Left |
| Expected future price increases | Suppliers may hold stock back today | Left |
Common supply determinants include input prices, technology, the number of sellers, government policies, prices of other goods producers can make, and producer expectations.
What Shifts Supply in International Sourcing?
For cross-border ecommerce and wholesale businesses, the supply curve is influenced by more than factory-gate pricing. A commercially useful analysis must include the total landed-cost environment and the operating conditions between production and final delivery.
1. Raw Materials and Component Costs
A product’s supply can tighten when the cost of inputs rises. For a supplier of stainless-steel drinkware, examples include steel, silicone seals, packaging, labor, electricity, and freight to the export port.
When costs increase sharply, suppliers may:
– Raise MOQ requirements.
– Increase unit prices.
– Stop accepting small or customized orders.
– Prioritize high-volume accounts.
– Reduce the variety of SKUs they keep available.
For buyers, the key question is not simply, “Has the price increased?” Instead, ask: Has the supplier’s cost structure changed enough to reduce supply across all price levels?
2. Capacity, Technology, and Supplier Network
Automation, better forecasting software, improved tooling, and standardized processes can expand a supplier’s effective output. That tends to shift supply rightward because each unit can be produced more efficiently.
At the marketplace level, access to more verified factories and trading partners can also increase sourcing options. A B2B buyer may not control total market supply, but they can improve their effective available supply by gaining access to more suitable suppliers, products, and fulfillment paths.
3. Seasonality and Factory Calendars
Supply availability is rarely uniform throughout the year. Chinese manufacturing schedules, peak retail periods, product-launch cycles, and major holidays can change lead times and supplier responsiveness.
A product may look abundant in one month but become constrained before a major shopping season. Buyers that wait until demand peaks can face:
– Longer production queues.
– Higher purchase costs.
– Reduced customization flexibility.
– More expensive shipping options.
– Greater stockout risk.
4. Logistics and Fulfillment Capacity
A supplier can have finished goods ready, yet the buyer may still experience a practical supply shortage if the products cannot be inspected, consolidated, shipped, or delivered reliably.
For global sellers, usable supply is best understood as:
Usable Supply=Factory Output−Quality Failures−Fulfillment Delays−Logistics Constraints
This is why a sourcing decision should assess both product availability and fulfillment readiness.
How to Use a Supply Curve in B2B Purchasing
The supply curve becomes valuable when it supports an operating decision. Here is a practical five-step method for importers, online retailers, and wholesale sellers.
1. Track Your Landed Cost, Not Only Product Price
Calculate the full cost to make a product sale-ready:
– Unit product cost
– Sampling and customization cost
– Inspection or quality-control cost
– Packaging cost
– Domestic China shipping
– International freight or parcel delivery
– Duties, taxes, and payment fees
– Returns, damage, and replacement allowance
A supplier quotation can remain stable while your true landed cost rises because of packaging changes, freight conditions, or higher defect rates.
2. Identify the Supply Driver
When a quote or lead time changes, ask suppliers specific questions:
– Is the change caused by raw materials, labor, capacity, or exchange rates?
– Is the change temporary or structural?
– Has your MOQ changed?
– Are production lead times stable?
– Are alternative materials or specifications available?
– Can you reserve capacity for repeat orders?
This separates a short-term fluctuation from a genuine leftward supply shift.
3. Compare Multiple Supply Scenarios
Build at least three scenarios before committing capital:
| Scenario | Supply condition | Buying response |
| Stable | Cost and lead time are predictable | Reorder based on sales forecast |
| Tightening | Costs, MOQ, or production queues are rising | Secure supply earlier and qualify backups |
| Expanding | More suppliers or lower costs are available | Test variants and negotiate better terms |
4. Avoid Overstocking as the Default Response
A tight supply environment can tempt merchants to place large orders. But higher inventory does not automatically create a better business outcome.
Overbuying can lead to:
– Cash tied up in slow-moving stock.
– Storage and insurance costs.
– Product obsolescence.
– Lower flexibility to test new products.
– Greater exposure to changing customer demand.
For many catalog-based businesses, a sourcing and dropshipping model can help validate demand before committing to bulk inventory. Instead of holding every SKU locally, sellers can source products, route orders through a fulfillment partner, and replenish based on actual sales patterns.
5. Create a Supplier Risk Scorecard
Use a consistent scorecard for key products. Rate each supplier from 1 to 5 for:
– Unit-cost stability
– Quality consistency
– MOQ flexibility
– Production lead time
– Communication speed
– Customization capability
– Export documentation
– Fulfillment reliability
– Backup capacity
A low unit price is not always the lowest-risk option. The best supplier is often the one that offers the most reliable total supply outcome.
Expert Perspective: Supply Curves Do Not Replace Supplier Due Diligence
In my experience working with B2B sourcing decisions, the biggest mistake is using market logic without validating supplier-level facts. A supply curve explains the direction of pressure in a market. It does not confirm that a specific supplier has the inventory, certification, quality system, or delivery capability your business needs.
Treat the supply curve as an early-warning tool.
If supply appears to be tightening, verify:
– Current stock and replenishment frequency.
– Production capacity by month.
– Material availability.
– Quality-control process and defect-handling policy.
– Packaging standards for international delivery.
– Shipping methods, tracking, and destination coverage.
– Alternative suppliers for high-volume or best-selling SKUs.
For example, a seller sourcing seasonal home-organization products may see prices increase before a retail peak. Rather than placing a large speculative order, the seller can test a small group of high-potential items, monitor conversion and return rates, then increase purchasing only for proven products. This approach reduces inventory exposure while preserving room to respond to demand.
Build a More Flexible Supply Strategy with Looperbuy
The supply curve tells you why availability and cost change. Your sourcing model determines how well you respond.
Looperbuy helps global B2B sellers source Chinese products and arrange fulfillment without carrying unnecessary inventory, managing warehouse operations, handling fragmented supplier payments, or coordinating every logistics step independently. This can give businesses more room to test products, manage SKU variety, and respond to changing supply conditions.
Use a flexible sourcing workflow to focus capital on proven demand—not uncertain inventory.
Explore Looperbuy’s China sourcing and dropshipping services to identify suitable products, streamline procurement, and build a more responsive global fulfillment operation.
Frequently Asked Questions
1. What is a supply curve in simple terms?
A supply curve is a chart showing how much of a product sellers are willing and able to provide at different price levels. It usually slopes upward because suppliers generally offer more when prices are higher.
2. Why does a supply curve usually slope upward?
Higher prices can make additional production profitable. Suppliers may then increase output, use more capacity, or enter the market, provided other conditions remain unchanged.
3. What causes a supply curve to shift left?
A leftward shift means less supply is available at every price. Common causes include higher input costs, lower production capacity, disruptions, new taxes or regulations, and expectations of higher future prices.
4. What causes a supply curve to shift right?
A rightward shift means more product is available at every price. It may result from lower production costs, technological improvements, more sellers entering the market, favorable policy changes, or improved capacity.
5. What is the difference between supply and quantity supplied?
Supply refers to the entire relationship between price and the amounts sellers are willing to offer. Quantity supplied refers to one specific amount offered at one specific price. A price change causes movement along the curve; a non-price factor causes the entire curve to shift.
6. How can B2B buyers use supply-curve analysis?
B2B buyers can use it to anticipate price pressure, evaluate whether changes are temporary or structural, plan replenishment, identify supply risks, compare suppliers, and avoid overcommitting capital to inventory during uncertain market conditions.
References
1. Global Sources. “[Supply Curve in Economics].” Original topic reference supplied for this article; page access was unavailable during research.
2. NetSuite. “[Supply Curve Defined].” Explains supply curves, their axes, and the effects of non-price factors.
3. Khan Academy. “[Lesson Summary: Supply and Its Determinants].” Covers the law of supply and key determinants that shift supply.
4. Lumen Learning. “[Shifts in Demand and Supply for Goods and Services].” Clarifies movement along a curve versus a shift in supply.
5. Investopedia. “[Law of Supply and Demand in Economics: How It Works].” Provides an accessible explanation of the law of supply, capacity, competition, and elasticity considerations.
6. Pennsylvania State University. “[Supply Curve].” Discusses the supply curve’s relationship to producers’ costs and marginal cost.